Retail Demo Experience
Redesigning the demo experience on 210K+ retail PCs so shoppers can decide, not just browse.
Overview
75% of shoppers have already researched their PC online. When they walk into a store, they’re not browsing — they’re deciding. But Microsoft’s retail demo experience — the software running on every Windows PC at Best Buy, MediaMarkt, FNAC, and retailers worldwide — was answering that decision moment with rotating marketing content and spec sheets full of jargon.
Project RISE replaced that carousel with a decision-support system: collection-aware device pages, plain-language spec tooltips, test drives promoted to top-level navigation, and a guided compare tool. I redefined the content strategy, interaction model, and governance framework for an ecosystem of 24+ OEMs, 150+ retail partners, and 210K+ devices, then led the end-to-end design across all device types and retail contexts.
25K+
Retail stores
210K+
Active devices
24+
OEMs, 150+ retail partners
2025 · Research
In-store audits, stakeholder interviews, journey mapping. I owned synthesis.
2025 · Governance
Content authority levels and demo tiers. I owned the framework and partner alignment.
2025 to 2026 · Design
Device pages, tooltips, test drives, compare. I owned end-to-end UX and UI.
2026 · Rollout
Fleet rollout and six-stream measurement. I owned metric definitions.
Where the time went, and what I owned in each phase.
The challenge
75% of shoppers research PCs online before stepping into a store. They’ve read reviews, compared specs, and narrowed it down to two or three models. Now they’re standing in front of a row of open laptops, ready to commit. This is the most valuable moment in the entire purchase journey.
And we were wasting it.
1
Attract
The same rotating slides played on every device regardless of collection, price, or intent. A $599 student laptop and a $2,400 creator workstation told the same story.
Insight: Shoppers arrive at the shelf already at the journey’s Overwhelmed stage.
2
Engage
Nothing told shoppers what a device was, who it was for, or what it cost.
Insight: It took 3+ walk-throughs just to understand how devices were organized.
3
Explore
Specs were raw jargon, and the hands-on test drive, the most persuasive evidence, was buried in a hidden subsection.
Insight: “Trying to evaluate” was the journey’s Confused stage.
4
Decide
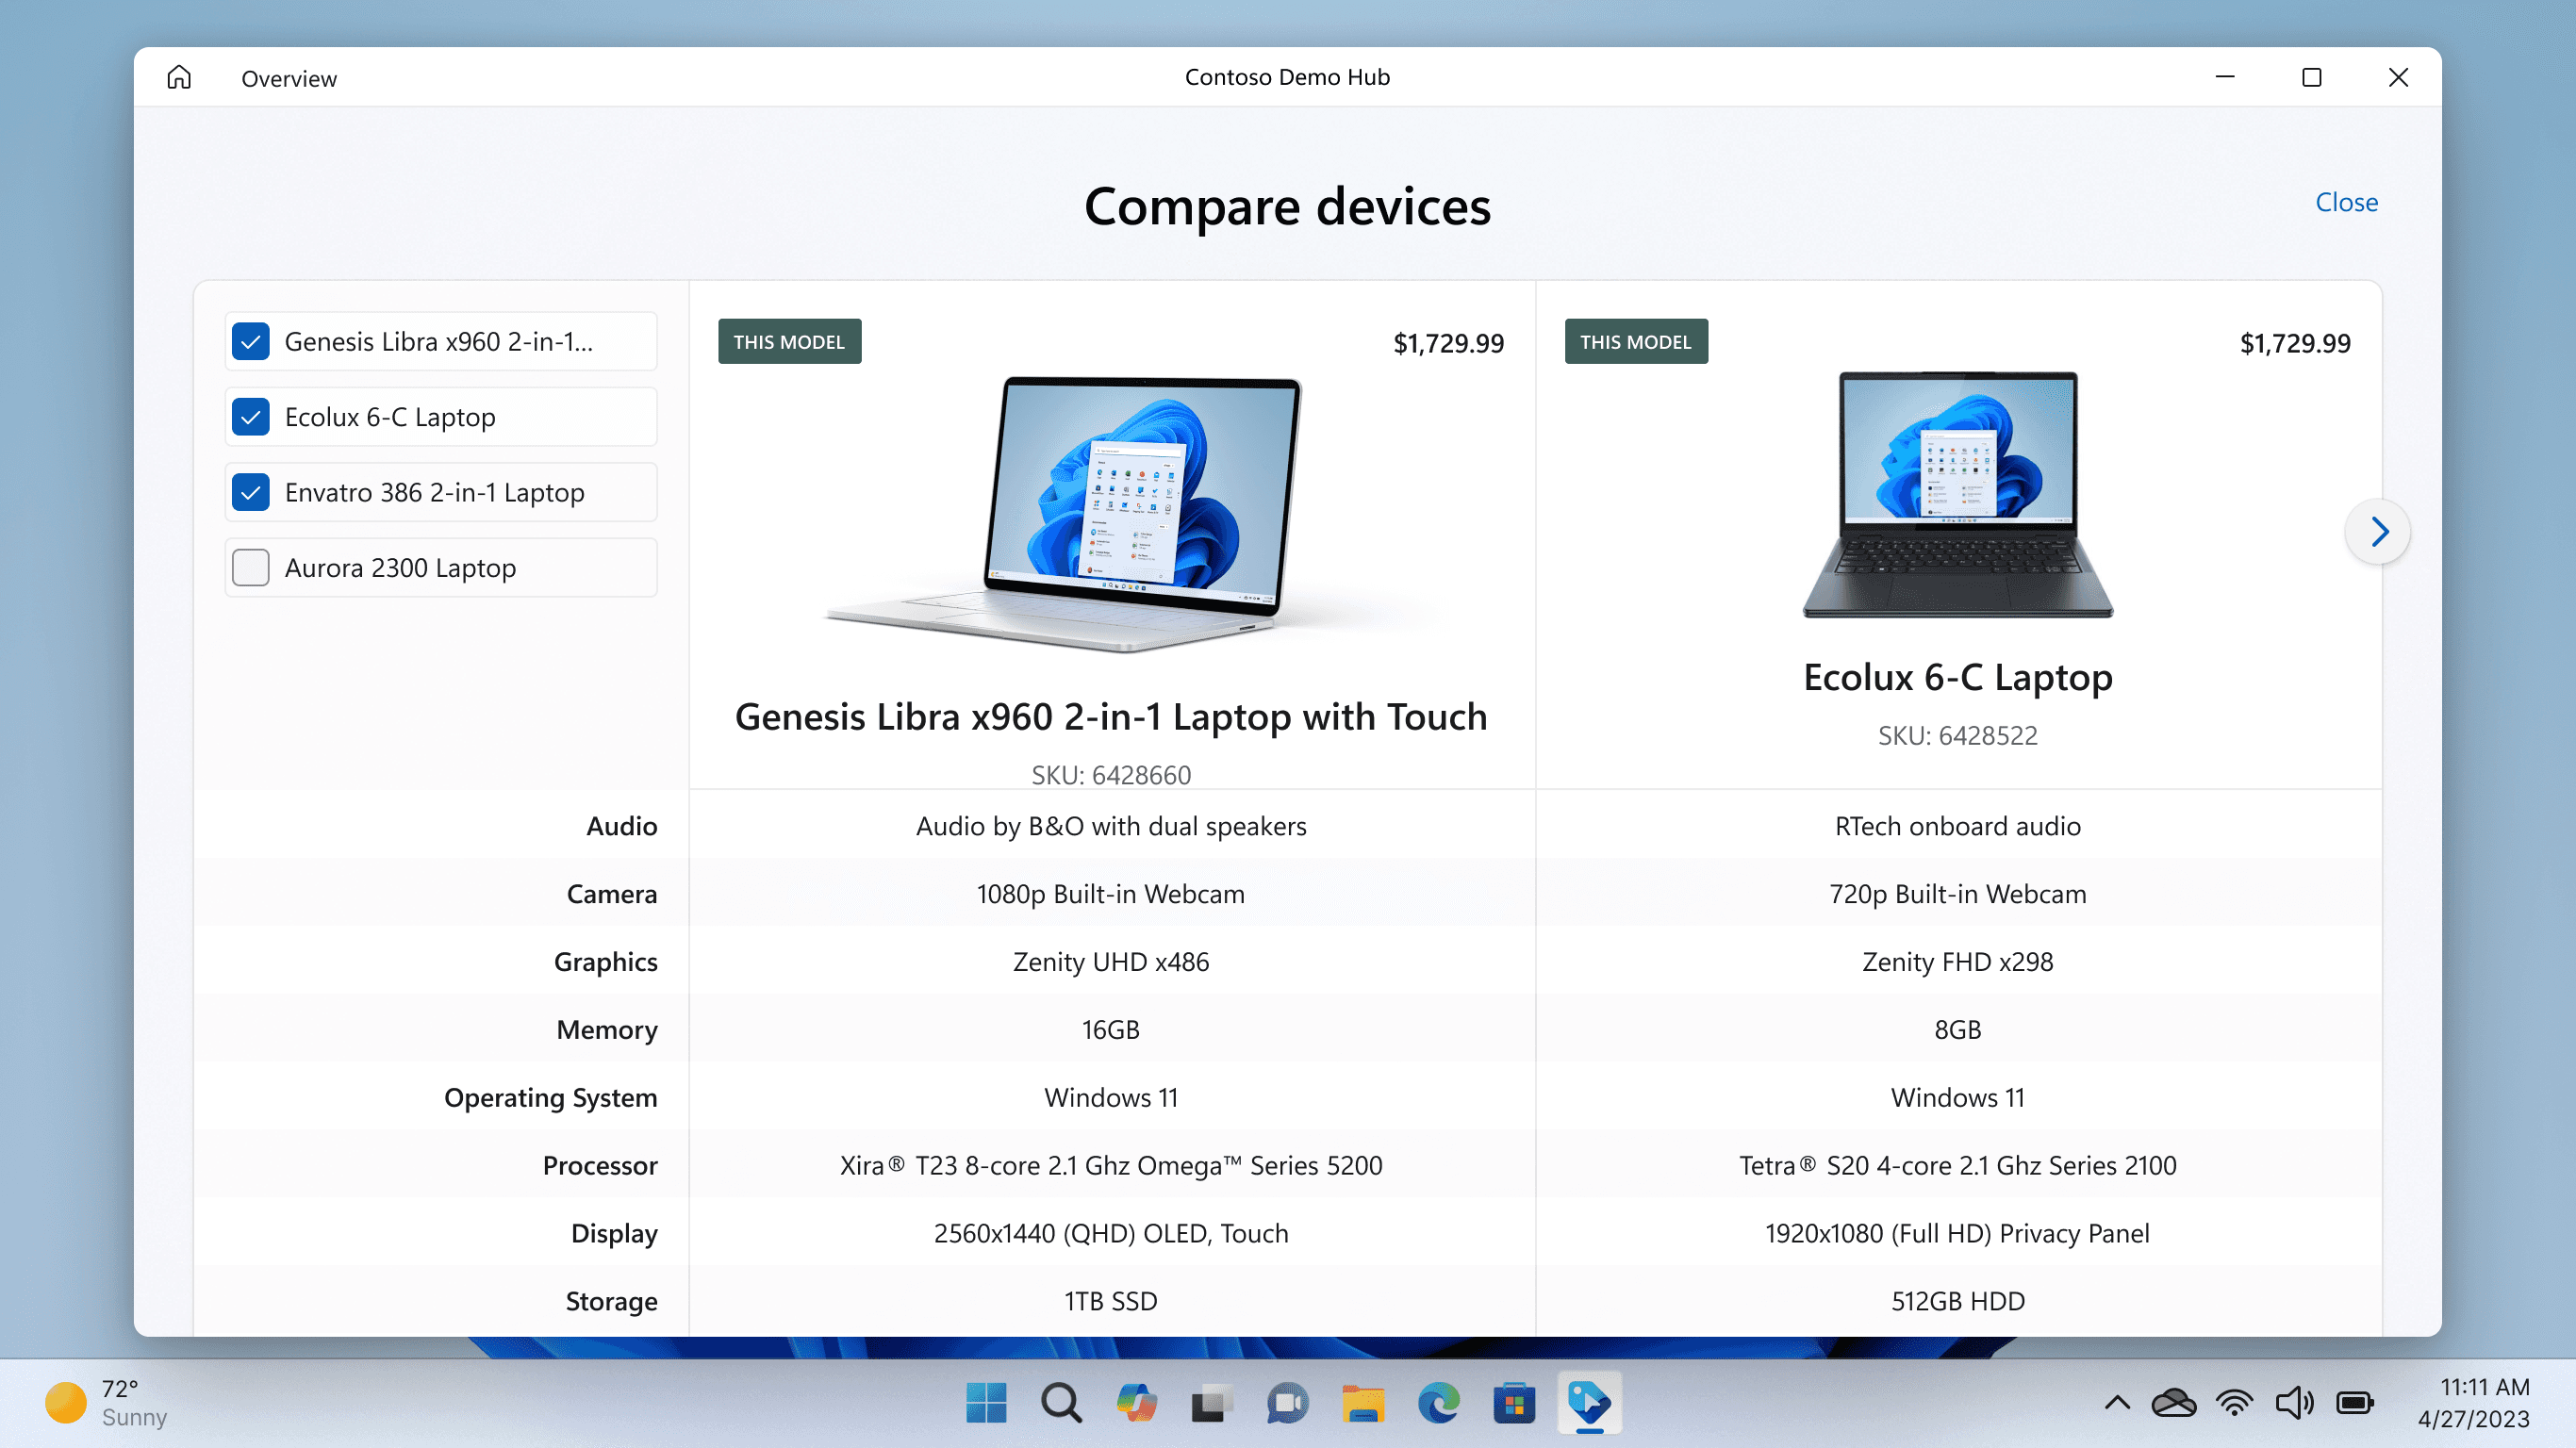
The compare tool showed spec tables without explaining a single difference.
Insight: “Narrowing the field” was the journey’s Doubt stage, and the tool at that moment explained nothing.
5
System-level problems
No framework for what ships: every stakeholder wanted screen space, with no mechanism for saying no. · No way to measure: 210K+ devices, and no consistent signal on what drove purchases.
The solutions follow the same four phases.
Research and discovery
I led research across in-store retail audits, stakeholder interviews with OEM and retail partners, and competitive analysis, and drew on Microsoft’s existing Windows 11 shopper journey study, a two-phase qualitative program across the US and Germany, as the foundation for shopper understanding.
5 shopper audiences
Followed in the Windows 11 shopper journey study
2 study phases
Online boards, then mini groups, US and Germany
6 journey stages
An emotional arc from excitement to doubt
10 in-store stages
Mapped across the demo interaction arc
How the research was run
The purchase journey
The study mapped six stages shoppers move through, and how each one feels.
Deciding to get a PC
Excited
Starting the search
Overwhelmed
Trying to evaluate
Confused
Seeking help
Building confidence
Narrowing the field
Doubt
Making the purchase
Excited again
The in-store demo meets shoppers at the two hardest stages: evaluating and deciding.
The in-store arc
Journey mapping revealed ten stages, each needing different content and interaction.
Attract
1 Attract loop
2 Presence wake
Engage
3 Hover preview
4 Click home
Explore
5 Explore features
6 Open specs
7 Desktop tasks
Decide
8 Call associate
9 Configuration
10 Purchase
The full in-store arc. Each stage needs different content, density, and interaction.
The jobs to be done
The strategy reduced the shopper encounter to three jobs, each broken into sub-jobs with a job story capturing the moment, the motivation, and the outcome. Every screen, demo, and content slot in RISE serves one of them. Open any job to see its sub-jobs.
Get my attention
3 sub-jobs
Validate my research
3 sub-jobs
Decide with confidence
3 sub-jobs
Personas
The study followed five shopper audiences. Read across each row: who they are, where their journey breaks down, and how RISE answers it.
Persona
Active seeker parents
Find a family PC without making an expensive mistake.
The pain
Information overload and fear of buyer’s remorse: too many choices, and the wrong one is on them.
Key jobs
Narrow the field fast · Compare from their question, not a spec table
Persona
Shoppers replacing an old PC, 45+
Replace a 4+ year old Windows PC with confidence.
The pain
Did not understand what they need; jargon made them feel incompetent until someone translated it.
Key jobs
Understand every spec in plain language · Evaluate without needing an associate
Persona
PC gamers
Put their research to work and feel the performance.
The pain
Loved learning, but faced too many options and anxiety at the moment of purchase.
Key jobs
Feel the performance hands-on · Commit without second-guessing
Persona
Power buyers
Get the right machine for demanding, varied work.
The pain
Cross-referencing multiple sites to decode terms; customization options added confusion instead of confidence.
Key jobs
Decode specs in context · Compare configurations in one place
Persona
Prosumers
Enjoy the hunt, land the right price-performance balance.
The pain
The sheer number of options, and recommendations that ignored their budget.
Key jobs
See what a device is and costs at a glance · Balance price against performance
Key decisions
Two calls shaped RISE before any screens were designed.
Collections as the organizing frame. The shopper study showed use-case categories beat spec categories, so devices are framed by collection: what this PC is for, who it serves, and why, before any spec appears. Insights became collections, and collections became the shared experience layer across attract, demo, and compare.
The call I made: organize the entire experience around the shopper’s use case, not the industry’s spec sheet.
One certified baseline. Years of per-partner concessions had fragmented the fleet. RISE defines a single certified demo baseline across devices and markets: consistent content, apps, and behavior, with partner customization inside the frame rather than around it.
The call I made: end the concessions and reinvest that effort into one experience every partner can trust.
Two frameworks enforce those calls day to day.
Content governance
With 24+ OEMs competing for screen space, I designed a seven-level governance model defining what ships and who decides.
1 Windows ecosystem, platform value that anchors the journey
2 Collections framing, the shared experience layer
3 OEM brand, differentiation inside the frame
4 Product family, Yoga, Inspiron, Surface and peers
5 Device-specific, the SKU features that drive decisions
6 Campaign overrides, time-bound and only in support of the levels above
7 Experimental content, never at the cost of decision clarity
The seven-level governance model, in priority order. Ties go to the higher level.
Paired with ship criteria: nothing ships if it is slower than out-of-box Windows, breaks the collection’s shared flows, contradicts a higher narrative, or fails quick-glance readability.
Demo prioritization
A three-tier prioritization framework governs which demos earn investment.
Primary, interactive
Drives the purchase decision across every collection
Display
Performance
Keyboard
Touchscreen
Speakers
Camera
Pen
Touchpad
Game demo
Secondary, informative
Matters to a specific collection or form factor
Battery
Storage
Memory
AI
Tertiary, explorative
Confirmation and exploration, minimal investment until data says otherwise
Apps
Weight
Documents library
Photos library
Videos library
The prioritization framework: what earns screen space, and what has to prove it.
Success metrics, defined up front
Both calls carried measurable targets from day one: session dwell time, attract-to-exploration rate, test-drive starts per session, and compare usage.
Design solution
Four problems stood between a shopper and a confident decision: anonymous devices, specs in jargon, buried test drives, and a comparison tool that explained nothing. Each solution below closes one of them. Each opens with the shopper job it serves. One principle runs through every screen, learned from watching shoppers in stores: hover reveals meaning, click is commitment.
AI in the workflow
I used Bolt to prototype competing directions for key screens before committing in Figma, trying variations of the hover model and compare tool in hours rather than sprint cycles, and ChatGPT to pressure-test the rationale behind each direction. The design decisions stayed mine.
1
Attract
2
Engage
3
Explore
4
Decide
A Collection-Aware Attract Loop
Persona
All five audiences — this is the moment before anyone self-selects
Pain
The same rotating slides played on every device, regardless of collection, price, or intent.
Job
Signal what this PC is for before I stop walking, so I stop at the right one.
The old way
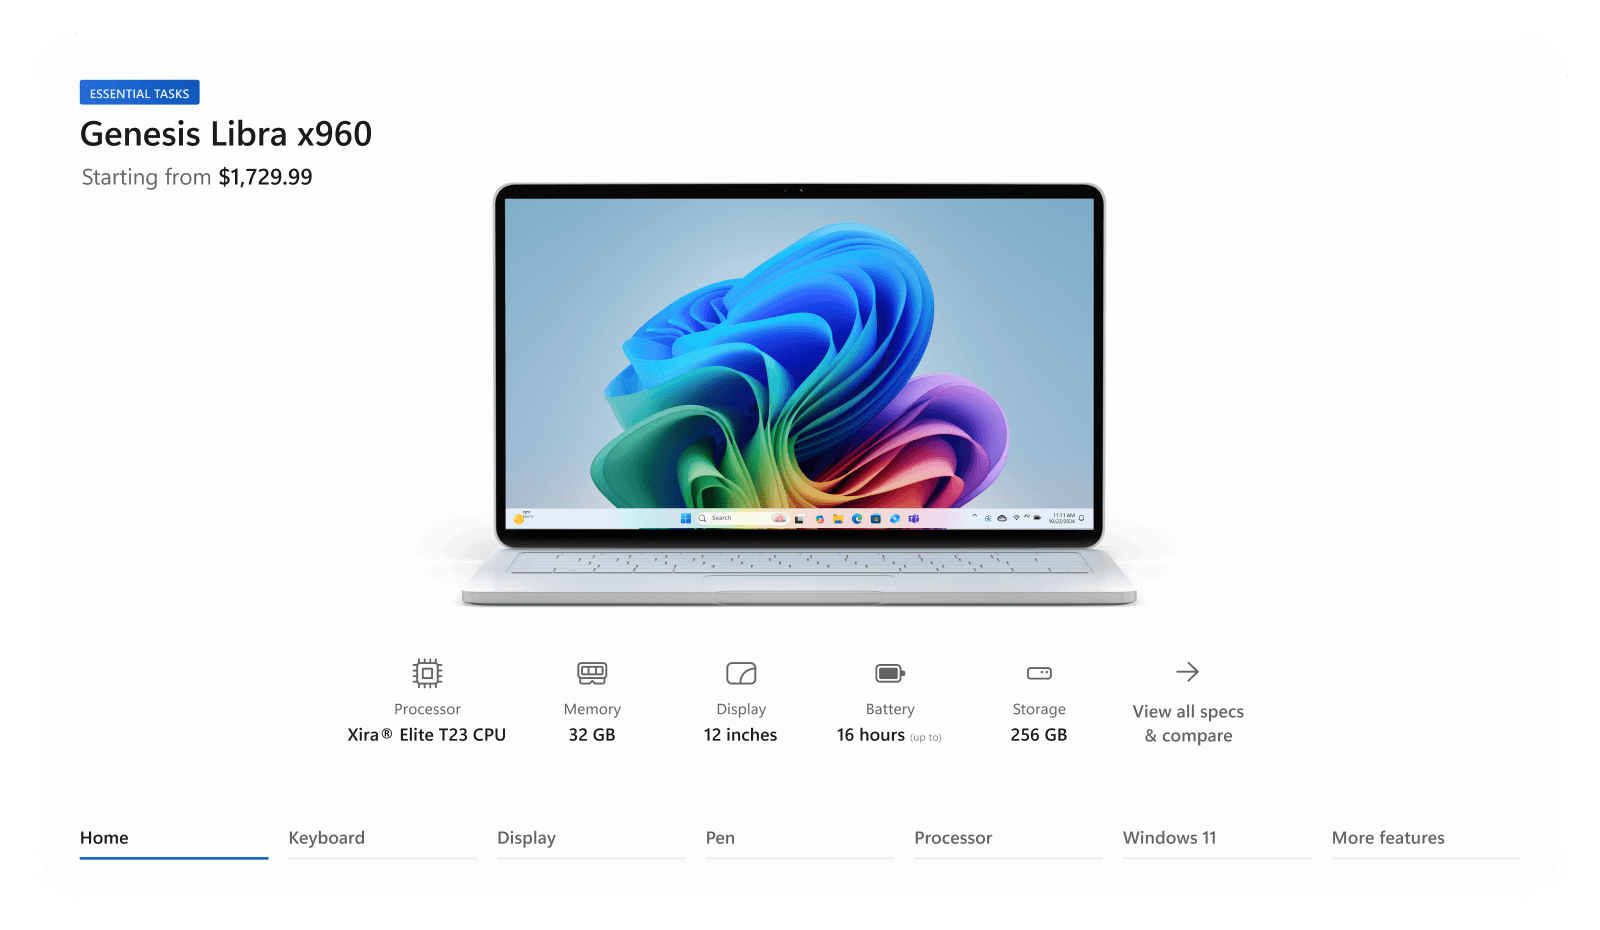
The old way: a static branded slide with a fact tag and QR code — identical on every device, saying nothing about this one.
Project RISE
After: the attract loop leads with the life the device is for — collection-tuned scenes with the device in context.
The call I made: The attract loop stopped selling and started signaling. Campaign content lost its permanent slot and only appears through the governance tiers, time-bound and in support of the collection story.

Impact
RISE is live across the fleet. Measurement merges six data streams: retailer sales, RDX telemetry, OEM SKU mapping, device engagement, door-level attribution, and campaign exposure, reported through monthly shared dashboards.
What the first dashboards show
Figures below come from the first two monthly dashboard cycles across 6,800 rollout doors, measured against the passive carousel baseline captured in the same doors pre-launch.
1:52
average dwell time per session, up from 0:41 on the passive carousel
34%
of sessions move from attract loop to active exploration, up from 11%
0.68
test drive starts per session, up from 0.09 after tab-level promotion
31%
of multi-device sessions open compare; 74% apply a filter before comparing
The redesign turned RDX from a passive marketing carousel into a decision-support system on 210K+ devices. Shoppers now spend nearly three times as long per session and reach a hands-on test drive seven times more often. Every change below traces back to one of the six problems in the challenge.
1 From browsing to deciding, collection-aware content tuned to device, price point, and shopper intent
2 From jargon to clarity, plain-language tooltips on every spec across 210K+ devices
3 From buried to primary, test drives promoted from a hidden subsection to tab-level navigation
4 From clutter to governance, a tiered hierarchy that decides what ships and what gets cut
5 From raw comparison to guided decision, filters adapt the comparison and highlight the better match
6 From unmeasured to instrumented, six data streams merged into monthly shared dashboards